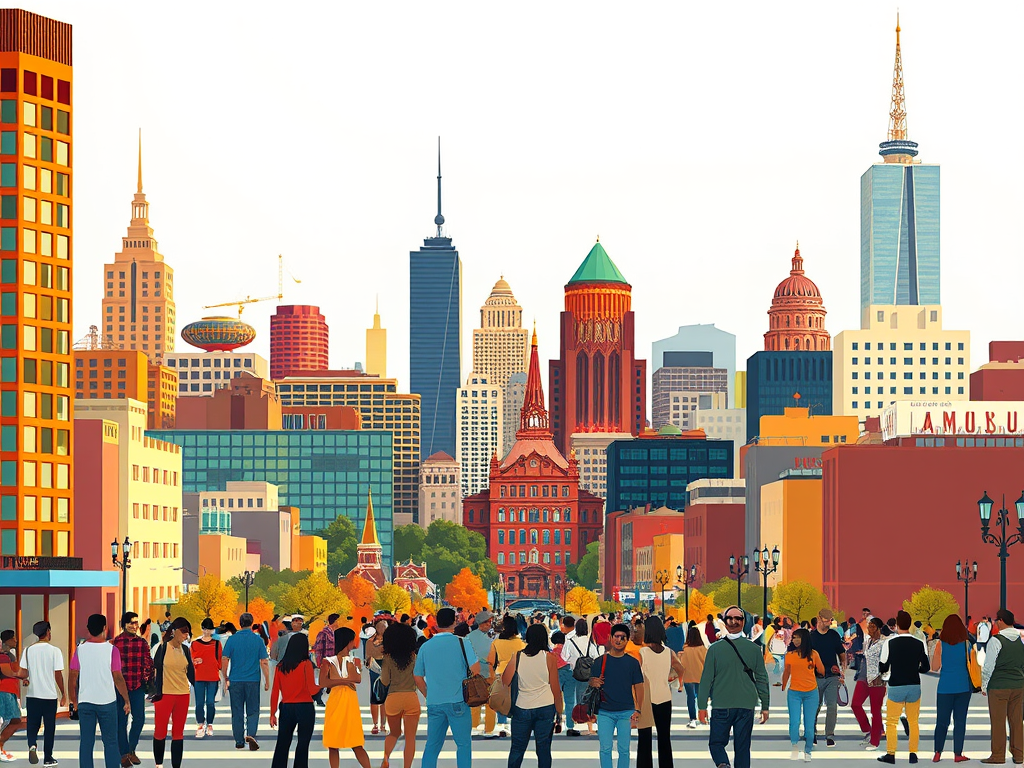
America is undergoing an extreme makeover, thanks to rapid demographic diversification. For example, the percentage of people in the U.S. who are multiracial increased from just 2.9% in 2010 to 10.2% in 2020. It’s important to embrace diversity – and it’s good for the economy, too.
Not only have waves of immigration changed the face of the nation, they’ve also brought in fresh perspectives, skills and technologies to help the U.S. develop a strong adaptability to change. Economies generally fare better when they openly embrace and capitalize on new ideas. Conversely, those relying on old ways and specialized industries tend to be hurt more by changes in the market.
To identify the most diverse cities in the U.S. WalletHub compared 501 of the largest cities across 13 metrics in five major diversity categories for. This article is the fourth installment in WalletHub’s diversity study series. It combines household diversity and religious diversity with our previous reports on socioeconomic diversity, cultural diversity and economic diversity.
“The most diverse cities demonstrate diversity in many dimensions – not just in race and gender but also everything from residents’ languages and birthplaces to their job types and household sizes. These cities blend together a multitude of different perspectives, helping people to better understand the world around them and become more empathetic. This exchange of ideas also tends to increase the economic success of diverse cities.”
Chip Lupo, WalletHub Analyst
In-Depth Look at the Most Diverse Cities
- Sioux Falls, SD, has the highest income diversity, 17.6% higher than the average of all cities.
- Oakland, CA, has the highest educational attainment diversity, 44.4% higher than the average of all cities.
- Germantown, MD, has the highest racial and ethnic diversity, 113% higher than the average of all cities.
- San Jose, CA, has the highest language diversity, 136.7% higher than the average of all cities.
- Jackson, WY, has the highest birthplace diversity, 123.5% higher than the average of all cities.
- West Valley City, UT, has the highest industry diversity, 40% higher than the average of all cities.
- Hialeah, FL, has the highest occupational diversity, 33.3% higher than the average of all cities.
- College, AK, has the highest worker-class diversity, 57.1% higher than the average of all cities.
- Brattleboro, VT, has the highest marital-status diversity, 28.6% higher than the average of all cities.
- South Portland, ME, has the highest age diversity, 13.3% higher than the average of all cities.
- Winooski, VT, has the highest household type diversity, 23.1% higher than the average of all cities.
- Waipahu, HI, has the highest household size diversity, 57.1% higher than the average of all cities.
- Saint Louis, MO, has the highest religious diversity, 137.5% higher than the average of all cities.
Discover more from The Cameron Journal
Subscribe to get the latest posts sent to your email.